
Upper airway imaging and deep learning
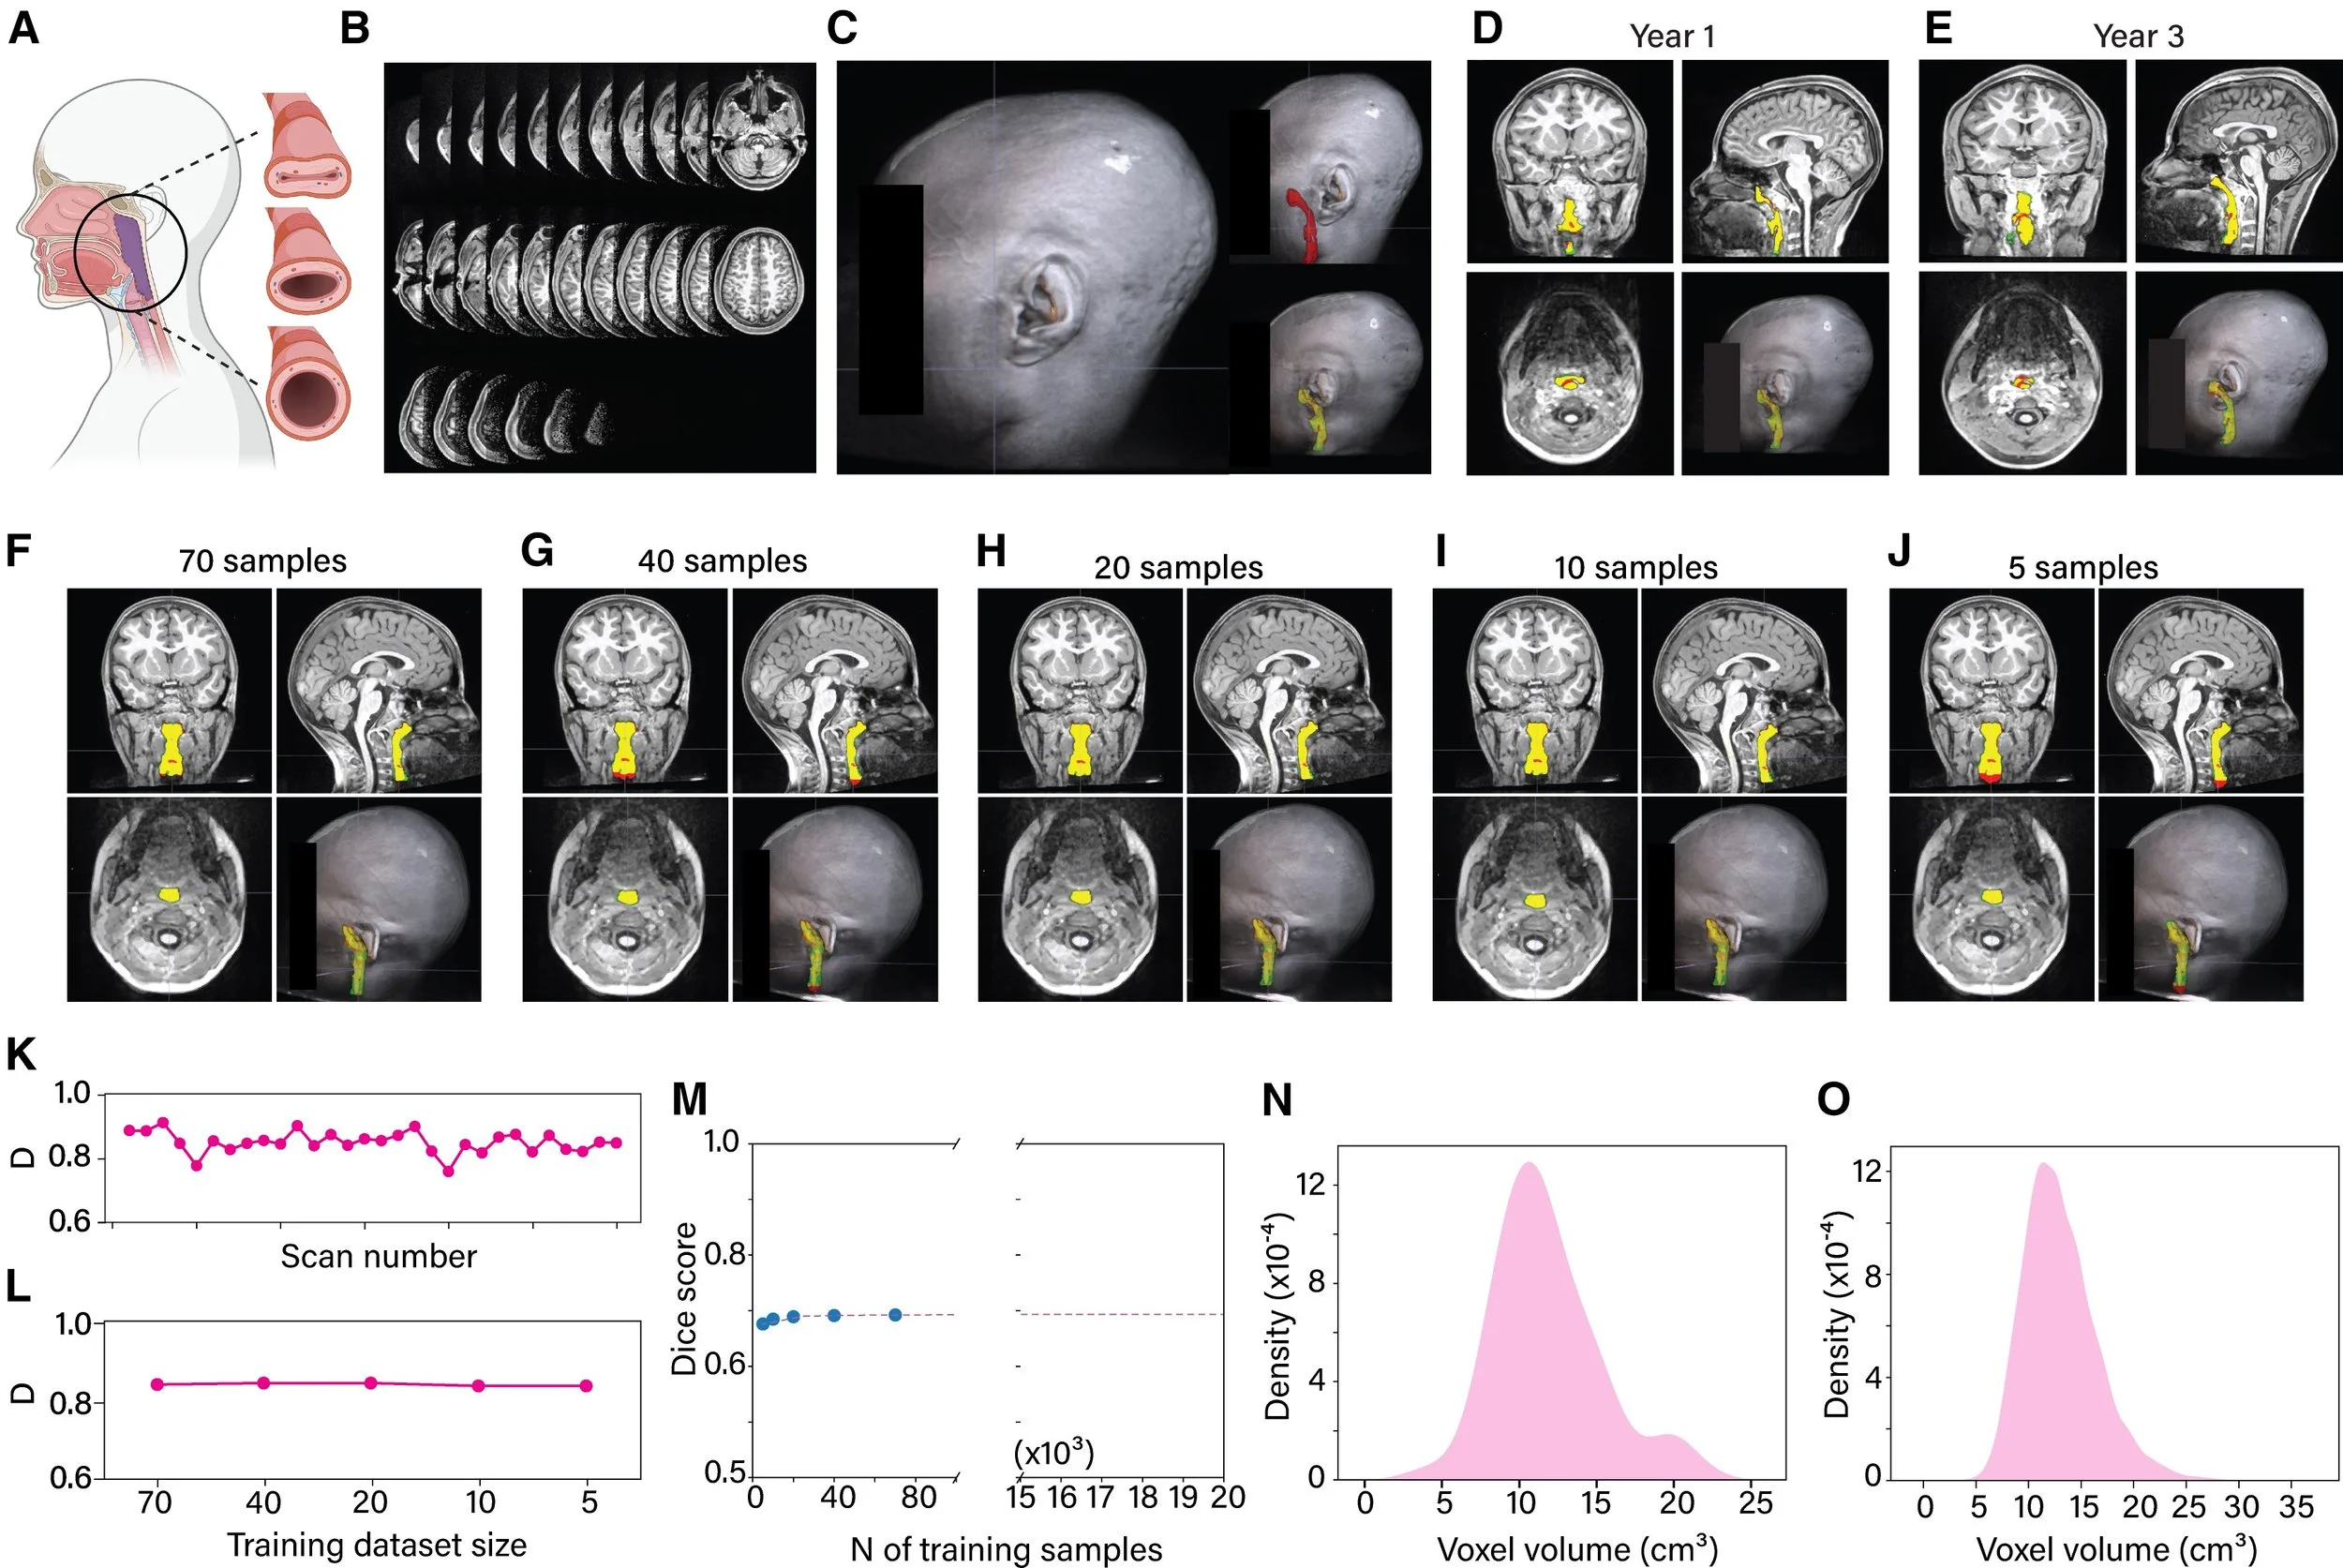
Automatic segmentation of the upper airway using deep learning: Panel A establishes what is being measured. The upper airway — the passage running from the back of the nose down to the level of the fourth neck vertebra — is the anatomical region relevant to sleep-disordered breathing. When children sleep, this passage can narrow or collapse to varying degrees, from mild restriction to near-complete obstruction. The panel illustrates this spectrum of collapse alongside the standard boundaries used to define the airway consistently across children. Panel B shows the raw material the model works with: a series of MRI slices through the head and neck, each capturing a thin cross-section of tissue. Stacked together, these slices form a three-dimensional image of the airway. Panel C shows what the deep learning model has learned to do — automatically detect and outline the airway within that three-dimensional volume, a task that would otherwise require a trained expert to trace each scan by hand. Panels D and E demonstrate the model's real-world utility by showing segmentation results from the same child scanned two years apart — at Year 1 and Year 3 of the study. Three colors are used throughout: green for the expert's manual outline, red for the model's output, and yellow where the two overlap. A large yellow region means close agreement between the model and the human expert. Panels F–J show what happens as the model is trained on progressively less data — 70, 40, 20, 10, and 5 scans respectively. This tests how data-hungry the model is, and whether acceptable performance can be achieved without requiring enormous labeled datasets, which are expensive and time-consuming to produce. Panels K and L quantify performance using the Dice coefficient — a standard metric that measures the degree of spatial overlap between the model's segmentation and the expert's, where a score of 1.0 represents perfect agreement. Panel K plots this score across 30 individual scans from 15 held-out children the model had never seen during training. Panel L summarizes the key finding: performance remained strong and relatively stable even as the training set shrank, suggesting the model is efficient and does not require hundreds of labeled examples to function well. Panels M–O address scalability. The study ultimately needed to segment 21,649 MRI volumes — far too many for manual review. Panel M uses a power law model to project how segmentation accuracy scales with training set size across the full dataset. Panels N and O compare the distribution of airway sizes in the 70-scan training set against all 21,649 volumes, confirming that the training data was representative of the full range of airway shapes and sizes encountered in the broader cohort — a critical condition for trusting that the model will generalize.
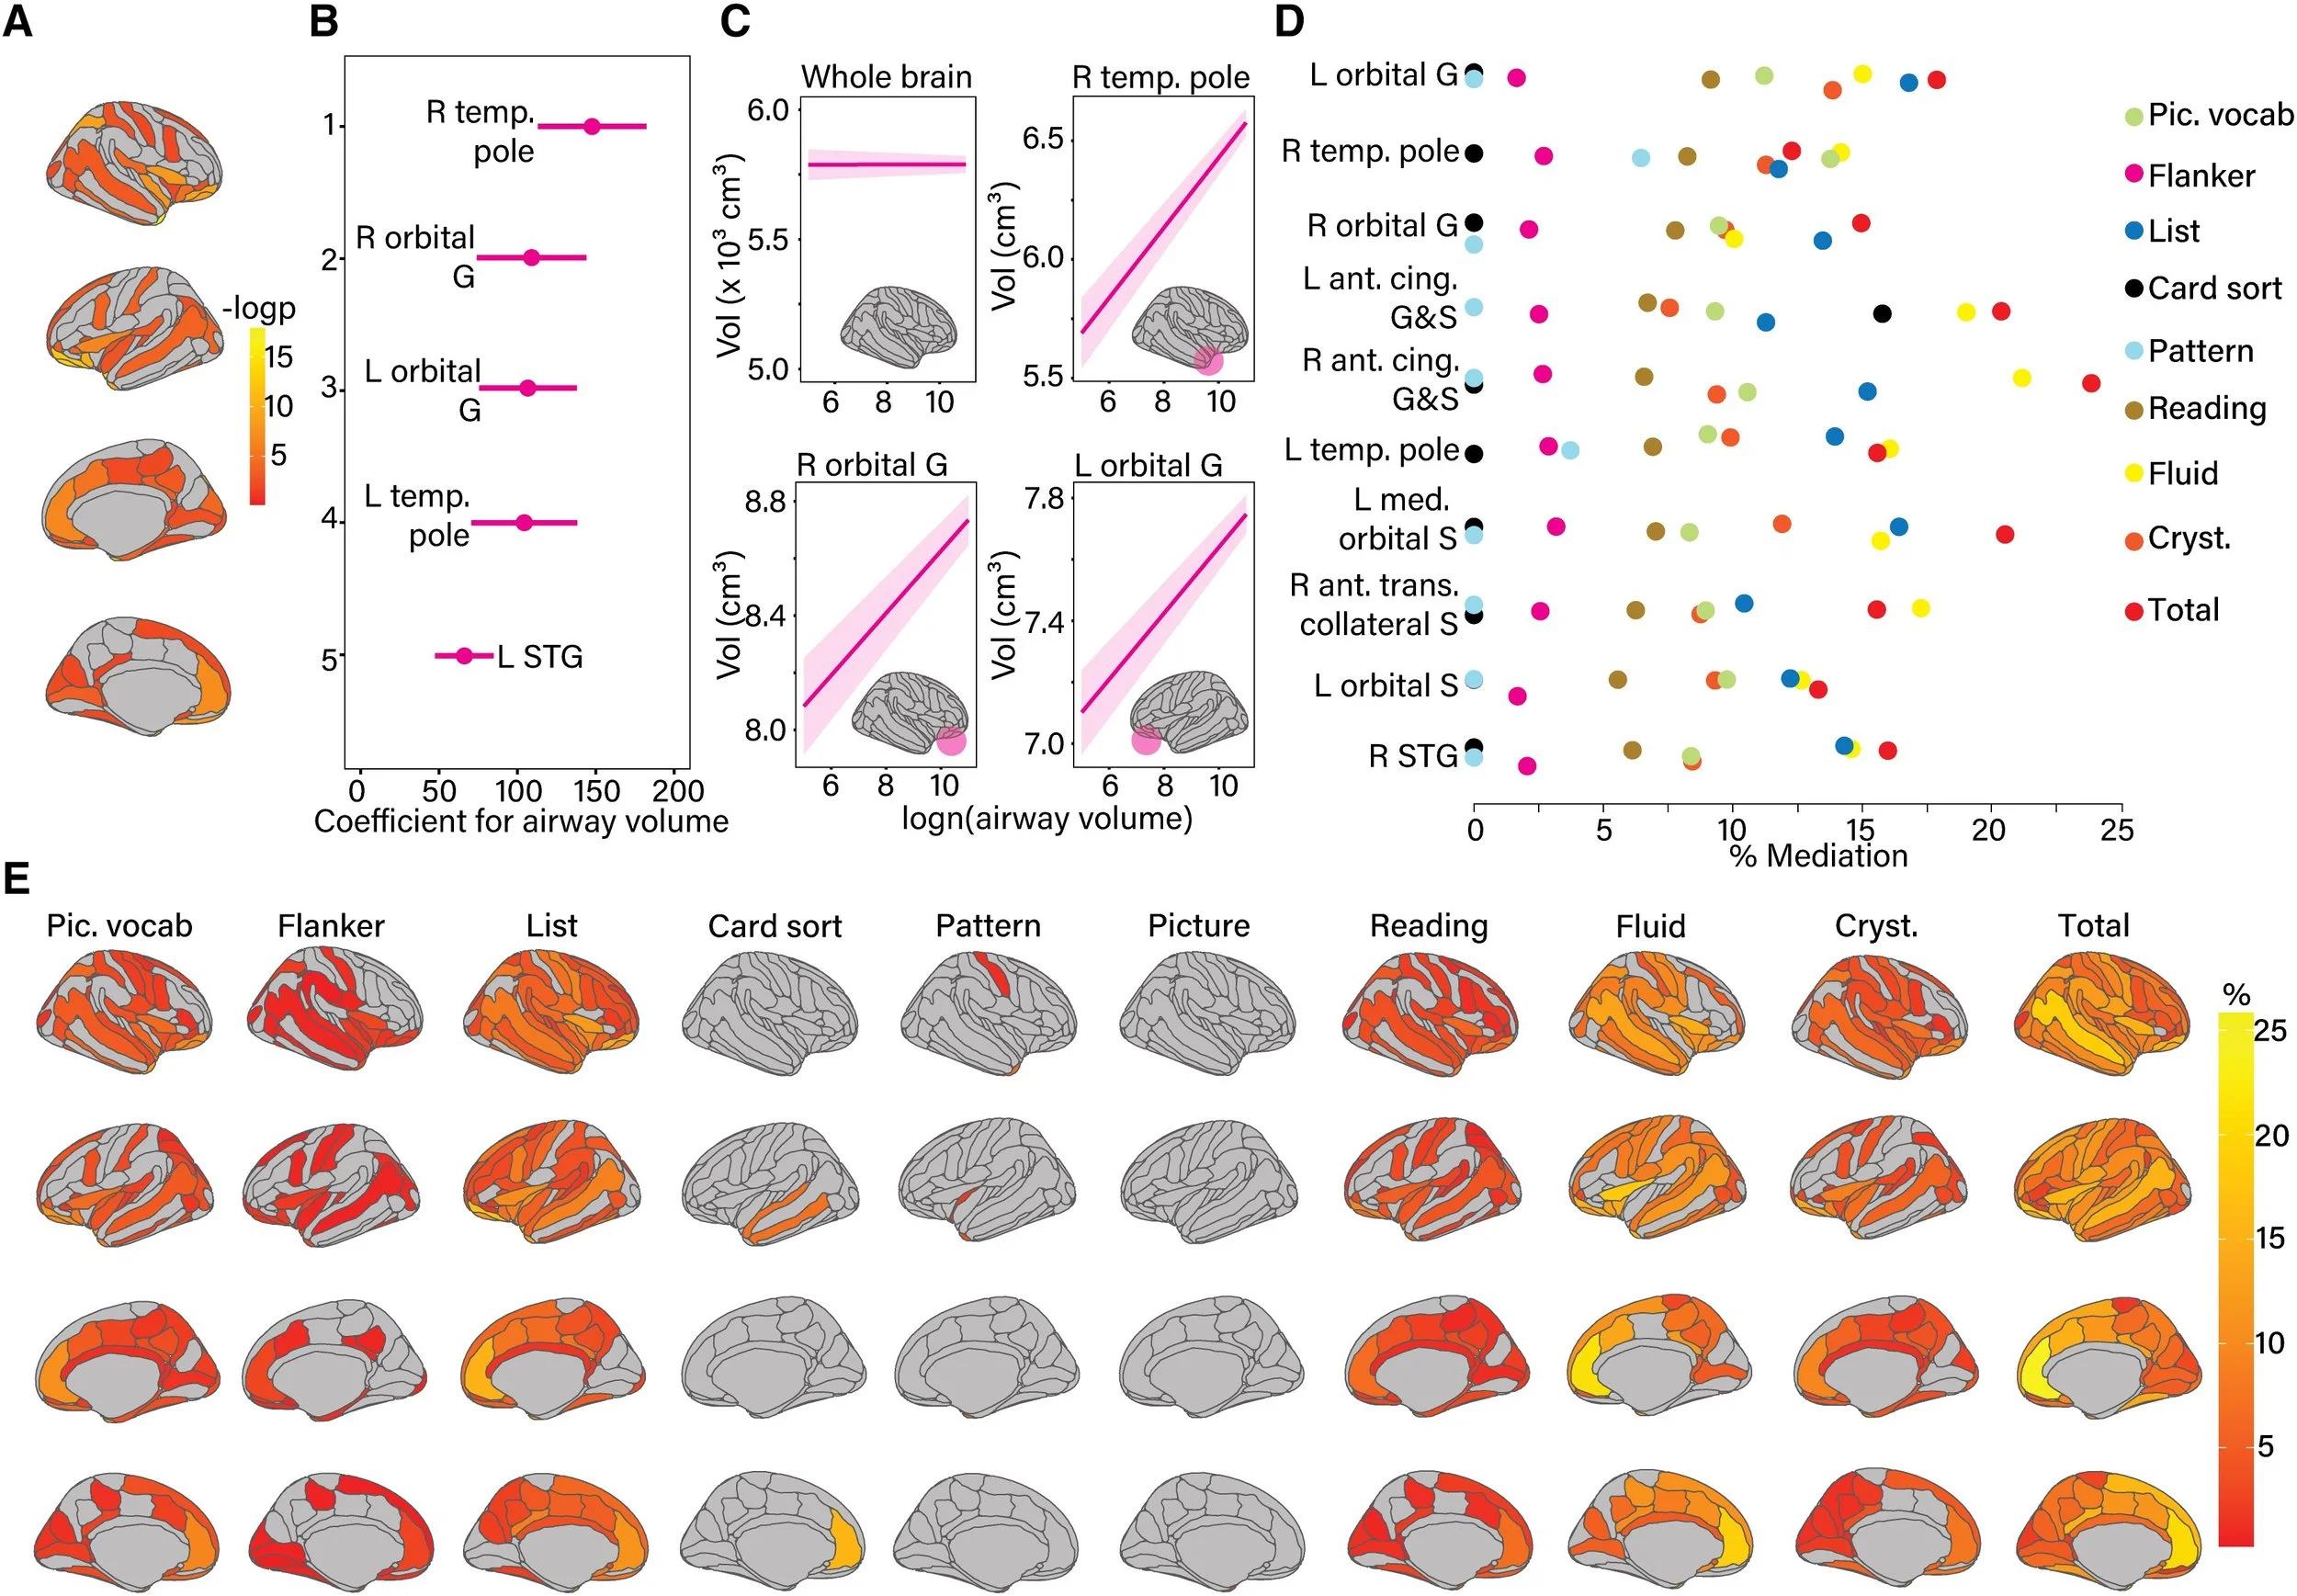
How airway size connects to brain structure — and what that means for how children think: Panel A maps the brain regions whose size tracks with the size of a child's upper airway. Using MRI measurements of both the airway and the cortex, the analysis identified specific regions where children with a smaller airway also tended to have less gray matter. The colored regions on the brain surface indicate where these associations were statistically significant, with stronger colors reflecting more robust relationships. Importantly, these associations were identified after accounting for differences in age, sex, race, family income, parental education, and body weight — meaning they reflect something specific to airway anatomy, not just background demographic variation. Panel B highlights the five brain regions with the strongest individual associations. These tend to cluster in the frontal and temporal lobes — areas involved in attention, language, memory, and executive control. Panel C makes an important distinction. Airway size was not associated with the total volume of gray matter across the whole brain — suggesting the effects are not simply a reflection of overall brain size or development. Instead, the associations are regionally specific, concentrated in areas like the orbital gyri (involved in decision-making and emotional regulation) and the temporal poles (involved in language and social cognition). This specificity strengthens the case that airway obstruction has a targeted rather than diffuse impact on the developing brain. Panel D moves from brain structure to cognitive function, asking whether the regional gray matter differences identified in panels A–C can explain — or mediate — the relationship between airway size and how children perform on standardized cognitive tests from the NIH Toolbox. The top ten brain regions that carry this mediation effect are ranked by the proportion of the total airway–cognition relationship they account for. In other words, these are the regions through which a smaller airway appears to translate into lower cognitive scores. Panel E illustrates the structure of each mediation model. The airway volume predicts a specific brain region, which in turn predicts cognitive performance — while controlling for age, sex, race, income, parental education, BMI, and the effects of scanning site and MRI scanner. Cognitive domains affected include crystallized intelligence and picture vocabulary, reflecting the particular vulnerability of language and knowledge-based abilities to the downstream effects of airway compromise. Taken together, these findings trace a coherent biological pathway: a smaller upper airway is associated with regionally specific reductions in gray matter in the frontal and temporal lobes, and those reductions partially explain why affected children score lower on cognitive assessments.
Automated detection of airway structures using ultrasound
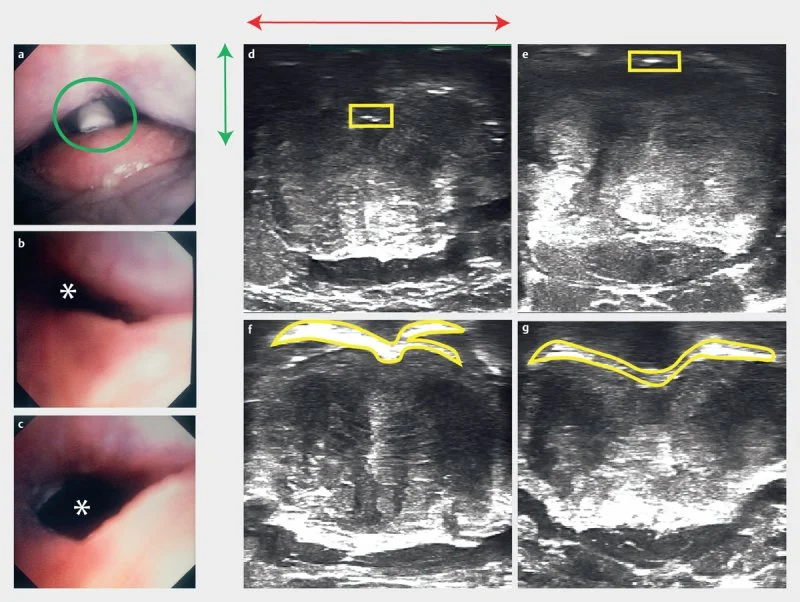
Confirming that ultrasound can detect airway collapse: These images validate the use of ultrasound to measure airway obstruction by comparing what an endoscope sees inside the airway with what an ultrasound detects from outside the neck. Panel A shows a photograph of the base of tongue and epiglottis, with the tracheostomy tube (green circle) used to create controlled airway collapse by applying suction. Panels B and C show the airway through an endoscope before and after releasing suction — collapsed in B, open in C. The asterisk marks the airway lumen. Panels D and E show the corresponding ultrasound images from outside the neck during suction. The yellow boxes highlight a compressed, faint air-tissue boundary — the ultrasound signature of a collapsed airway. The green and red lines in panel D confirm this interface sits in the posterior 40% of the neck. Panels F and G show the air-tissue interface manually outlined in yellow, corresponding to the open airway in panel C. Across all panels, the ultrasound signal faithfully tracks the real state of the airway — collapsing and reopening in step with what the endoscope directly confirms.
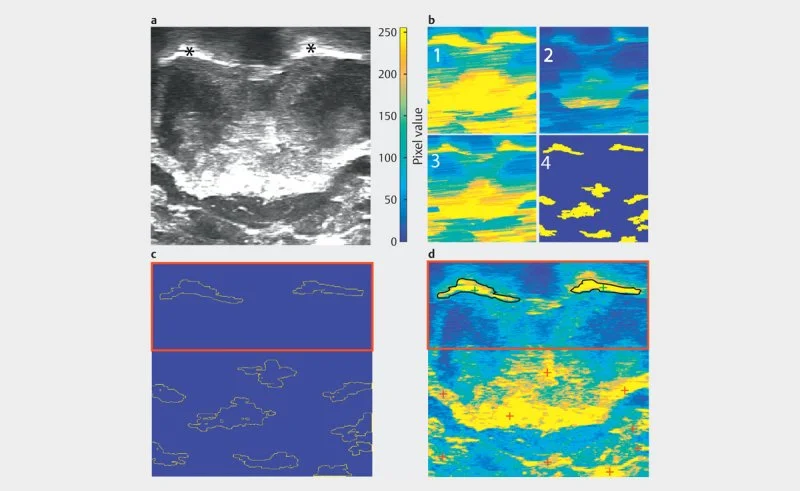
Automated identification of airway structures in ultrasound images: Panel A shows a raw grayscale ultrasound image. The two asterisks mark the structures of interest. Panel B shows the same image processed four times with a color scale (pixel values 0–250, blue to yellow), illustrating how pixel intensity varies across the image at different stages or thresholds of processing. Panel C shows the results of outlining — or segmenting — the structures of interest. The dotted outlines trace the boundaries of detected regions against a blue background. The red box highlights the area containing the primary structures being measured. Panel D overlays the final segmentation results onto the colorized image. The black outlines in the red-boxed region mark the structures that have been successfully identified and isolated. The red cross markers in the lower portion indicate reference points used in the analysis.